If you’re thinking about selling this spring, it’s time to get moving – the best week to list your house is fast approaching.
Experts at realtor.com looked at seasonal trends from recent years (excluding 2020 as an uncharacteristic year due to the onset of the pandemic) and determined the ideal week to list a house this year:
“Home sellers on the fence waiting for that perfect moment to sell should start preparations, because the best time to list a home in 2023 is approaching quickly. The week of April 16-22 is expected to have the ideal balance of housing market conditions that favor home sellers, more so than any other week in the year.”
If you’ve been waiting for the best time to sell, this is your chance. But remember, before you put your house on the market, you’ve got to get it ready. And if you haven’t started that process yet, you’ll need to move quickly. Here’s what you should keep in mind.
Work with an Agent To Determine Which Updates To Make
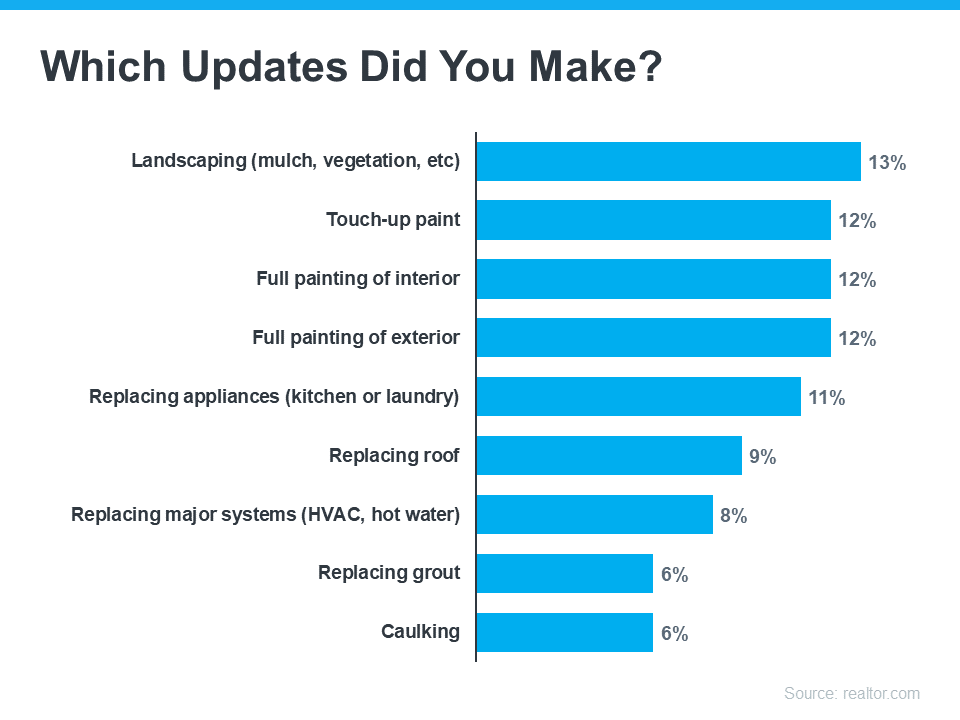
Start by prioritizing which updates you’ll make. In February, realtor.com asked more than 1,200 recent or potential home sellers what updates they ended up making to their house before listing it (see graph below):
As you can see, the most common answers included landscaping and painting. Work with a trusted real estate agent to determine what projects make the most sense for your goals and local market.
If Possible, Plan To Have Your House Staged
Once you’ve made any necessary repairs and updates to your house, consider having it staged. According to the National Association of Realtors (NAR), 82% of buyers’ agents said staging a home made it easier for a buyer to visualize the property as a future home. Additionally, almost half of buyers’ agents said home staging had an effect on most buyers’ view of the home in general. Homes that are staged typically sell faster and for a higher price because they help potential buyers more easily picture their new life in the house.
Bottom Line
Are you ready to sell this spring? Let’s connect to plan your next steps. You can start by making a checklist of what you think your house needs to get ready. Then, we can work together to prioritize your list and move forward together.


